home
***
CD-ROM
|
disk
|
FTP
|
other
***
search
/
PDR Electronic Library 2001 2AX
/
PDR Electronic Library 2001 2AX.iso
/
Data
/
Pdr
/
Images
/
77
/
60003301.JPG
< prev
next >
Tile
Joint Photographic Experts Group Image
|
2001-05-31
|
32.6 KB
|
480x544
|
8-bit (256 colors)
similar images
ocr:
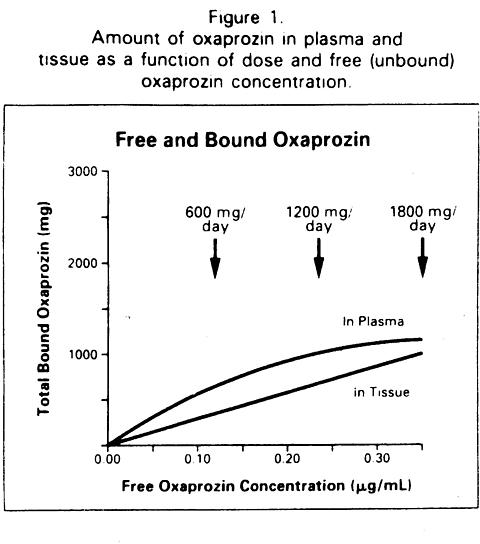
Figure 1. Amount of oxaprozin in plasma and tissue as a function of dose and free (unbound) oxaprozin concentration. Free and Bound Oxaprozin 3000 600 - mg/ 1200 mg' 1800 mgi day day day 2 2000 - InF Plasma - 1000 - - inl Tissue - - - - - - - - - - - 0.00 0.10 0.20 0.30 Free Oxaprozin Concentration (ug/mL)